Key Features
Introduction
The Razer QA Companion-AI combines intelligent automation with real-time analytics to streamline your game testing workflow. Its powerful features help QA teams capture, track, and analyze gameplay issues effortlessly. From bug detection to performance monitoring: all in one unified platform.
Dashboard
The Razer QA Companion-AI web dashboard is your main interface for managing test sessions, viewing bugs, triggering manual captures, and pushing issues to Jira.
Report & Bug Overview
Each game session automatically creates a report, listed chronologically on the dashboard.
Within each report:
- Rename the report
- View the list of bugs
- Manually trigger a bug
- Edit bug metadata (title, severity, description)
- Replay video or annotable screenshot (valid for 24h)
Settings & Utilities
From the General Settings tab, you can:
- Edit project settings
- View your Razer user ID and authentication token
- Connect Jira and manage integration
- Manage cookies and Hotjar tracking preferences
- Access useful links
Jira Integration
To streamline issue tracking, Razer QA Companion-AI allows direct Jira integration.
Setup
- Go to settings in the bottom left corner.
- Select Integrations page
- Click Add Credential
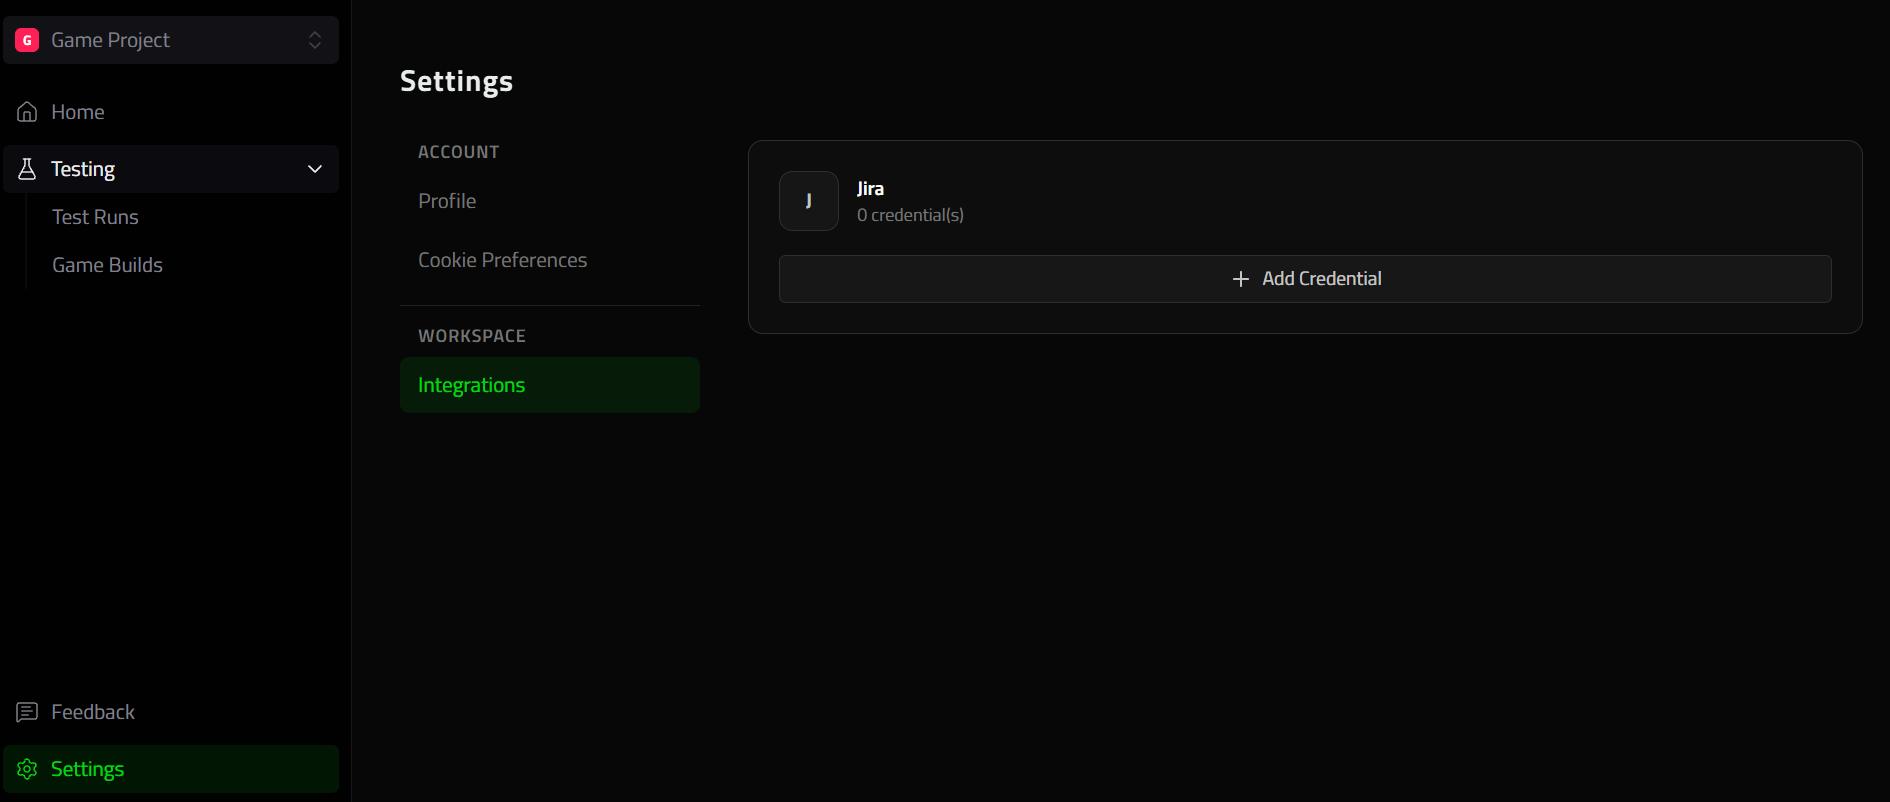
This will open a pop-up where you will fill with your Jira credenials
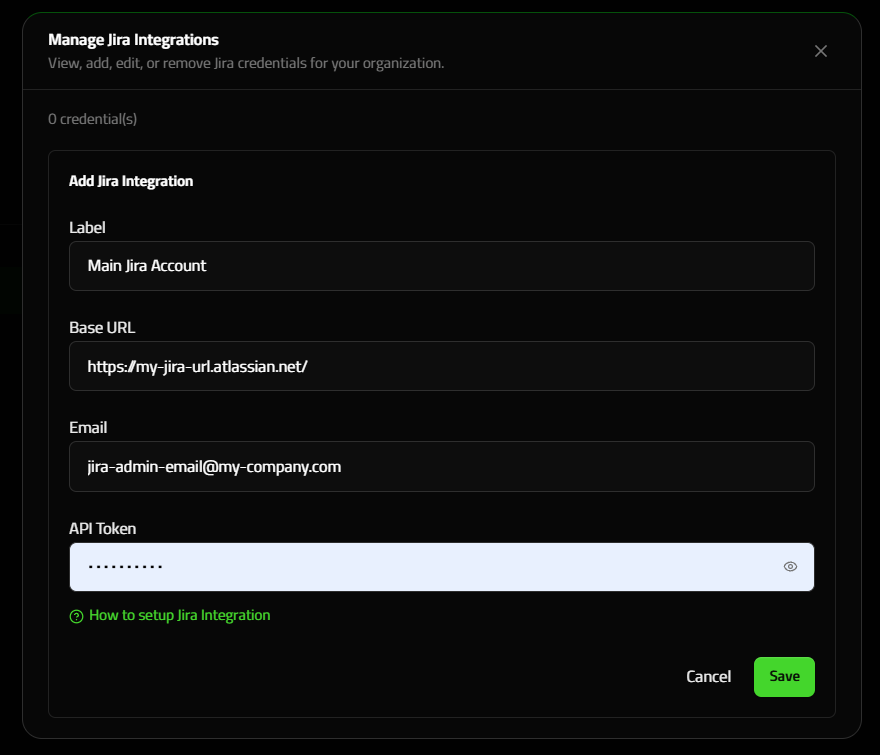
If you need help creating a Jira API key you can follow the following guide: How to setup Jira Integration
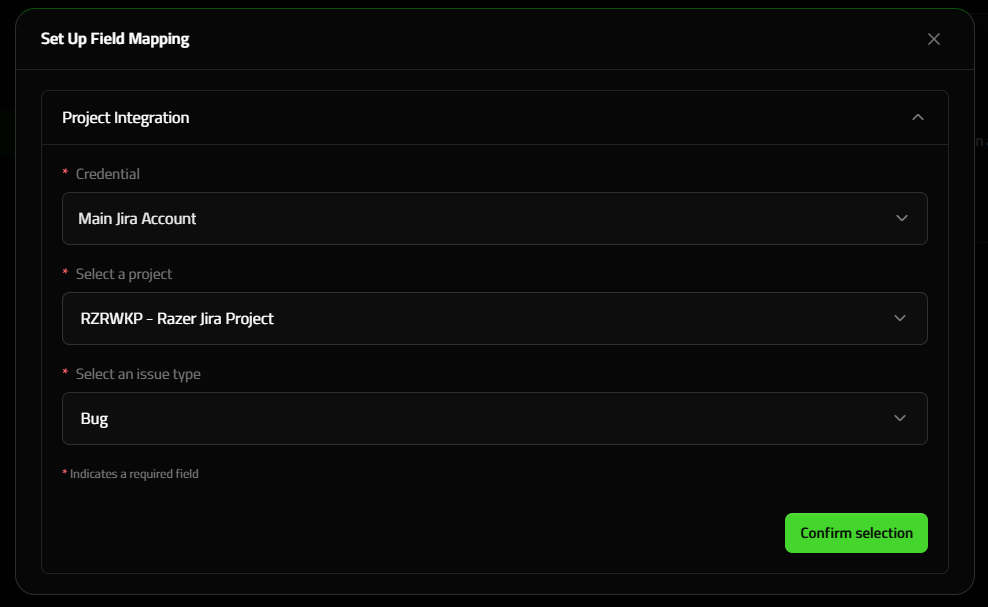
Field Mapping
Once your Jira project is connected, you must set the field mappings for each project in order to use this feature.
- Go to your project's settings, by clicking on the project selection drop-down an selecting 'Project Settings'
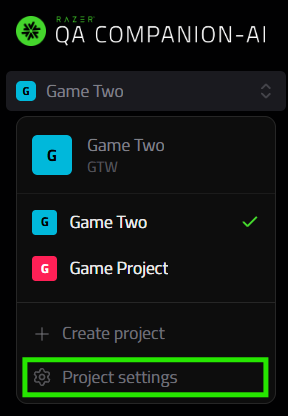
- Go to integrations
- Select 'Get started'
A pop-up will open so you map you fields according to the selected Jira project
Usage
From any valid bug (with a video or annotable screenshot under 24h):
- Click “Export to Jira”
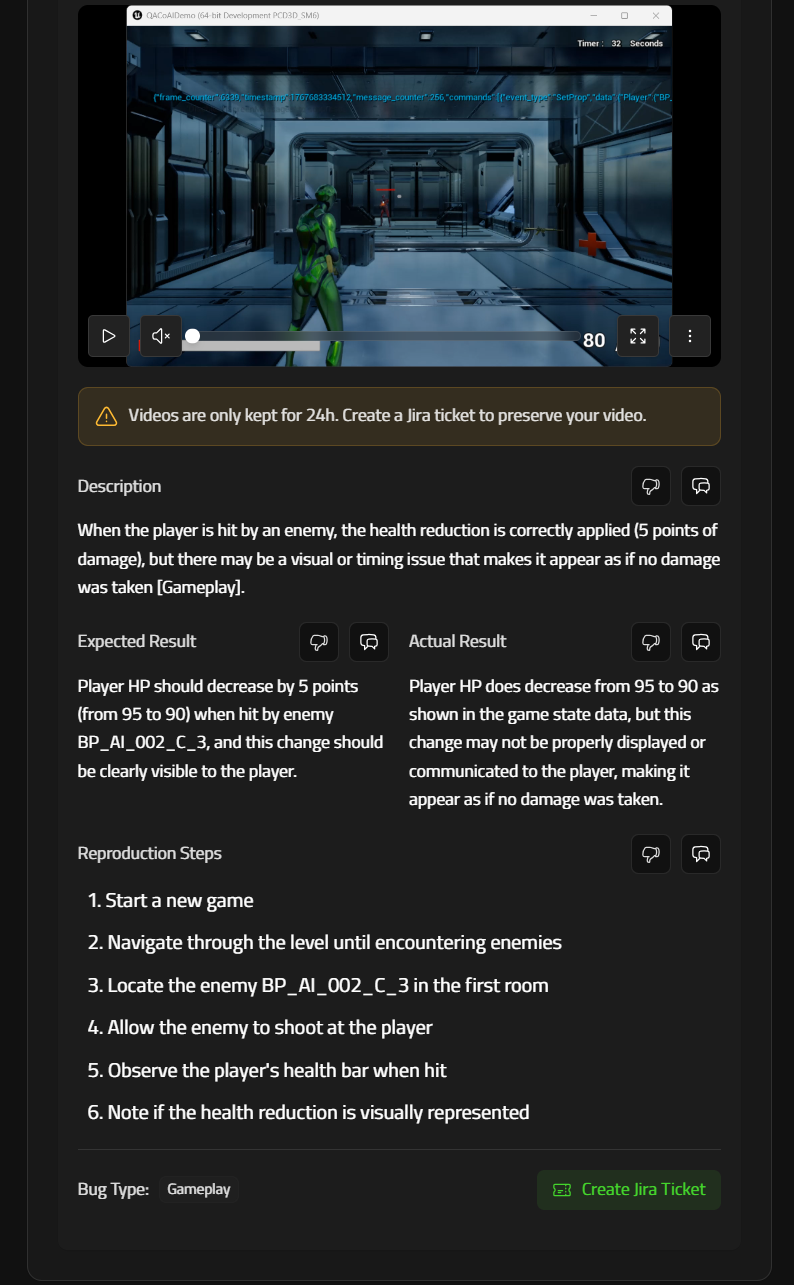
- Fields auto-filled: title, description, severity, reproduction steps
- Video or screenshot is attached if still available
- Expired videos and screenshots are omitted automatically.
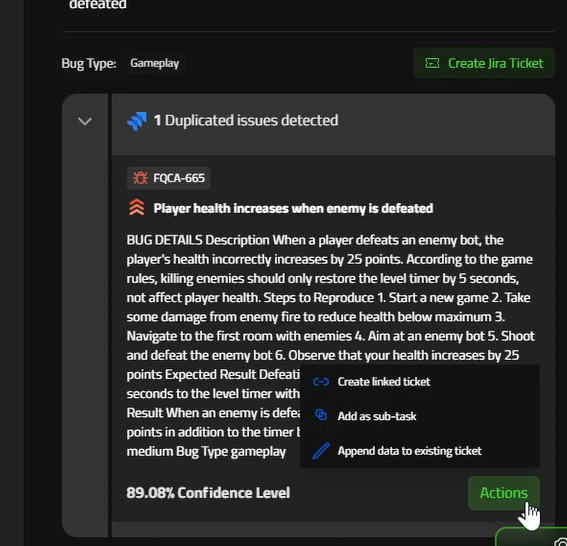
Duplicated bug detection
Our system leverages AI language analysis to verify your tickets within your Jira Project, intelligently identifying duplicate bug reports across projects. This reduces noise, streamlines triage, and improves prioritization by surfacing recurring issues and linking related reports with contextual awareness.
Performance Tracking
Performance Tracking lets you monitor your game’s FPS, CPU usage, GPU usage, and Memory consumption in real-time while a QA session is running.
When any metric breaches a user-defined threshold, the Companion automatically raises a “Performance Issue” bug entry, tags the exact timestamp, and pins a red dot on the live graph so you can correlate slow-downs with in-game events.
Why it matters
- Catch hard-to-reproduce frame-rate drops early
- Surface hidden GPU/CPU spikes in complex scenes
- Produce objective data for optimization passes
Starting a Session with Metrics Enabled
- Open the web application and click Start a new QA session.
- Select and fill in the usual fields:
- Process Name – Search or select the executable to track (e.g. MyGame).
- Build – internal build tag (max 20 chars).
- In the Performance thresholds panel (see screenshot ①):
- FPS Min – frames-per-second floor (default 30). Drag the sliders or type exact percentages for upper and lower bound thresholds:
- Memory % (0–100)
- CPU % (0–100)
- GPU % (0–100)
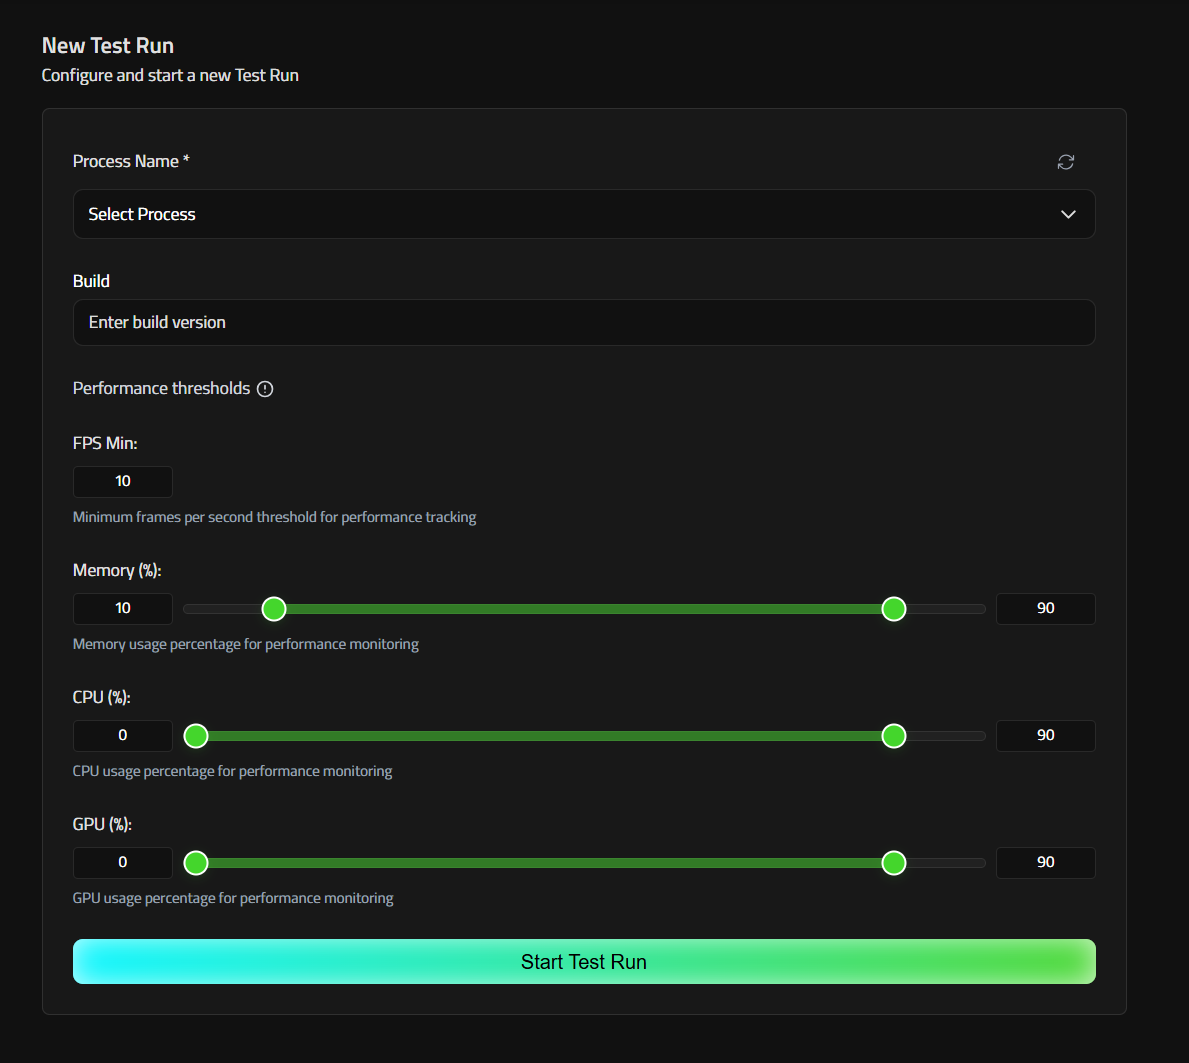
- Click Start new QA session.
- Performance metrics will be tracked and performance issues automatically reported.
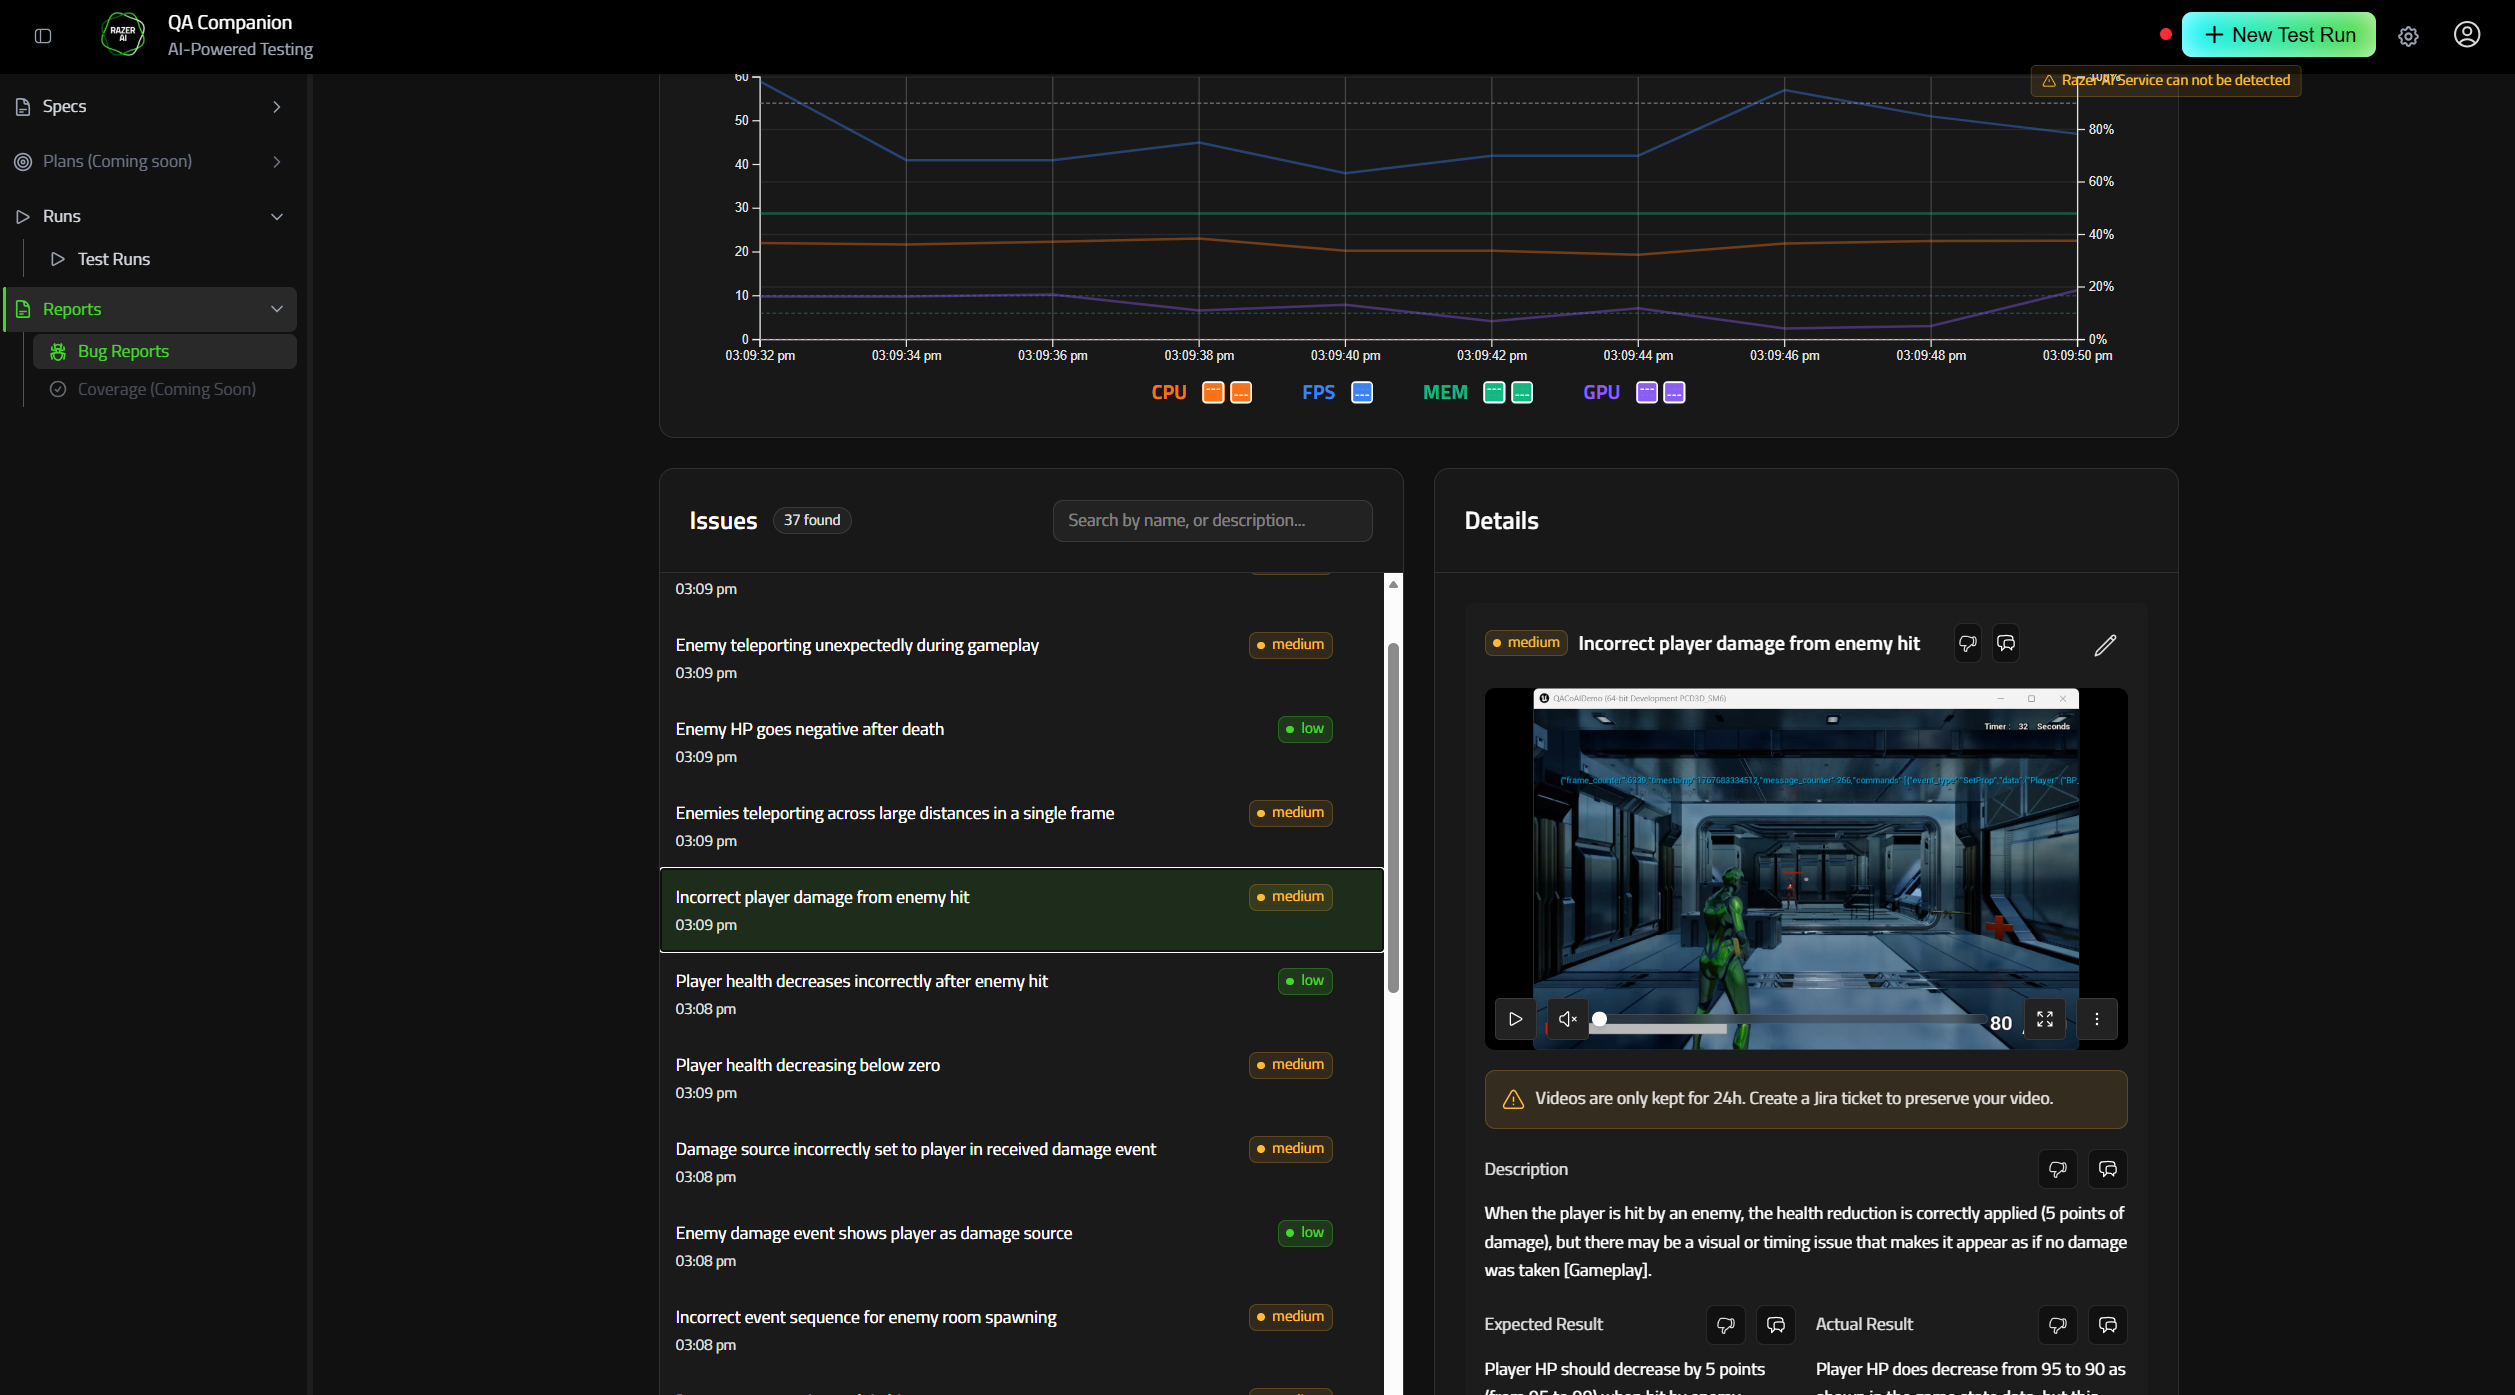
Live Graph & Threshold Indicators
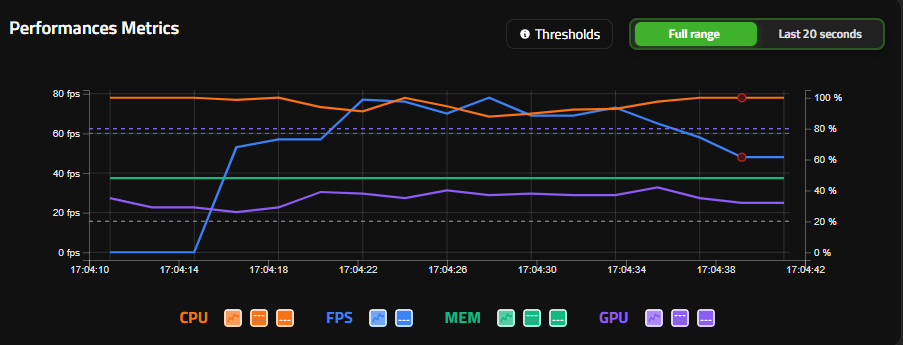
During the session the Performance Metrics graph appears in the Report view:
| Legend | Description |
|---|---|
| Orange line (CPU) | CPU utilization %. |
| Blue line (FPS) | Frames-per-second. |
| Green line (MEM) | System memory utilization %. |
| Purple line (GPU) | GPU utilization %. |
| Red dots | Timestamp when metrics breached thresholds – a “Performance Issue” bug is auto-logged. Checked every 30 seconds. |
Use the Last 20 seconds / Full range toggle to zoom, or hover any point to see exact values and compare against your limits.
Reviewing the Auto-Generated Performance Issues
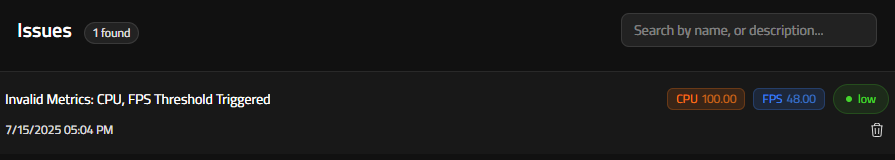
Each Red dot set creates a bug issue entry:
- Scroll down to the Issues section inside the current report.
- Entries of type Invalid Metrics list:
- Timestamp & metric(s) threshold triggered.
- Snapshot of metric values at that instance.
- 20 s gameplay video (same capture window as standard bugs).
- Edit severity/description if needed.
Manual bug report
The Manual Bug Report feature lets testers capture and document bugs on demand, ensuring that every detail—visual or contextual—is recorded accurately.
Usage
To manually report a bug using Razer QA Companion-AI:
- In the dashboard, select the currently open report.
- Reproduce the bug you want to capture.
- Trigger the report using one of the following methods:
- Click the Screenshot or Video button located at the bottom right of the interface.
- Use the designated hotkeys:
- Ctrl + B for a Screenshot
- Ctrl + Shift + B for a Video
- Ctrl + Shift + V for a Vision-AI bug detection
After a few seconds, the new bug will appear in the bug list, automatically linked to the active report. Screenshots can be edited using the in-app annotation interface, allowing you to highlight and comment on specific areas before submission.
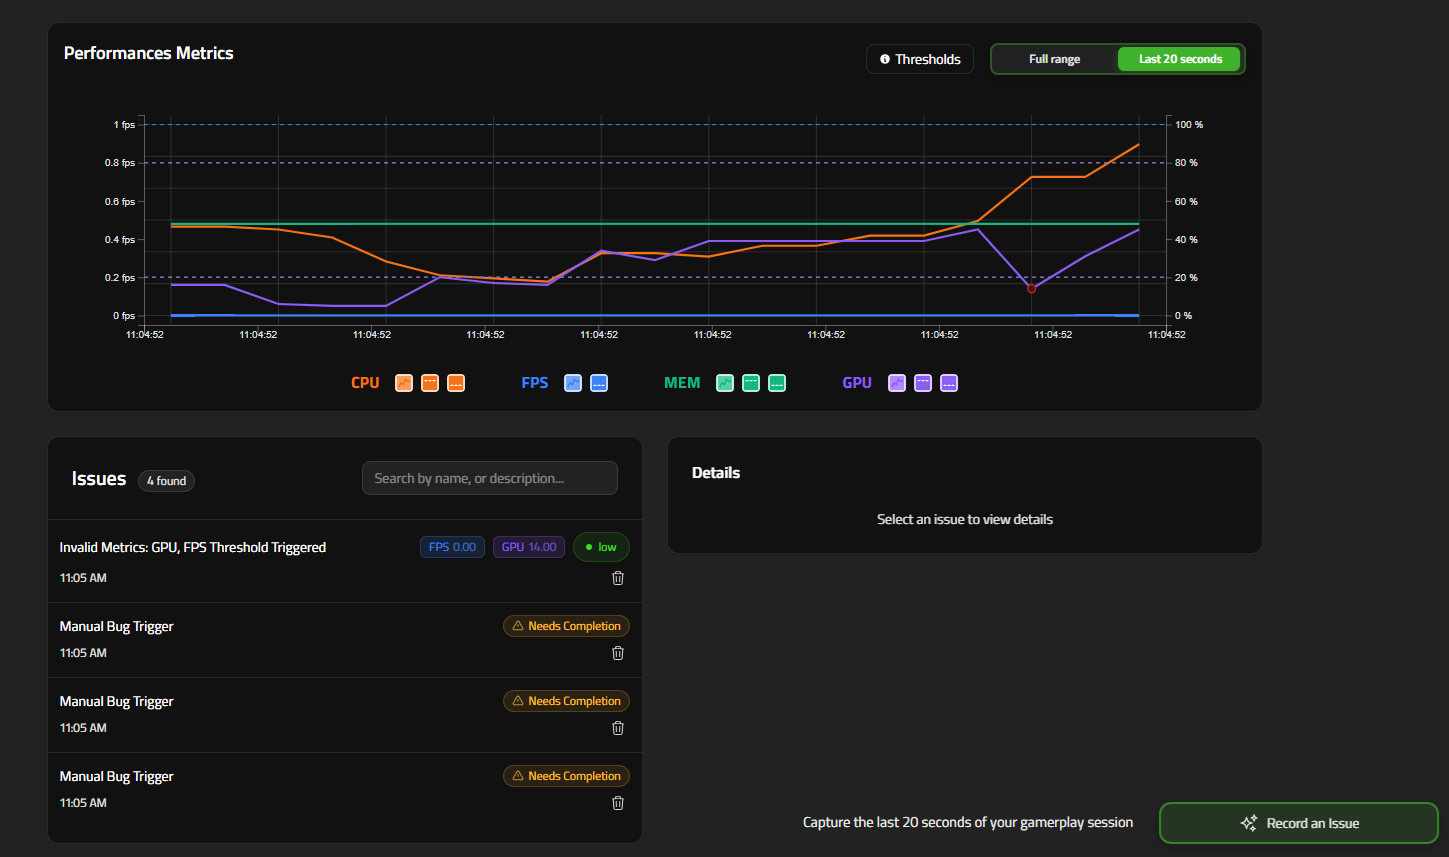
Image and Video storage expiration
Bug-related screenshots and videos are available for 24 hours after capture. After this period:
- Screenshots will no longer be accessible.
- Videos will no longer be playable.
- Jira exports will exclude the screenshot and video content.
- Bug metadata (such as title, description, and tags) will remain available.